Microeconomics vs. Macroeconomics
The difference between micro and macro economics is simple. Microeconomics is the study of economics at an individual, group or company level. Macroeconomics, on the other hand, is the study of a national economy as a whole.
Microeconomics focuses on issues that affect individuals and companies. This could mean studying the supply and demand for a specific product, the production that an individual or business is capable of, or the effects of regulations on a business.
Macroeconomics focuses on issues that affect the economy as a whole. Some of the most common focuses of macroeconomics include unemployment rates, the gross domestic product of an economy, and the effects of exports and imports.
Does this make sense? While both fields of economics often use the same principles and formulas to solve problems, microeconomics is the study of economics at a far smaller scale, while macroeconomics is the study of large-scale economic issues.
Market Systems
Market system refers to the method of allocating scare resources through the market forces of demand and supply
Market consists of
–Buyers (who have demand for a particular goods and services)
–Sellers (suppliers of particular goods and services)
Market equilibrium
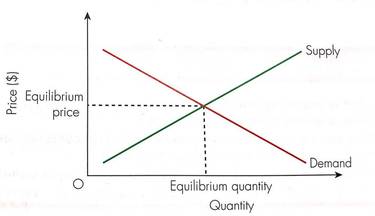
Market equilibrium occurs when the demand of a product matches the supply
An equilibrium price and quantity are established, when the opposing market forces of supply and demand are in balance
Market disequilibrium occurs when the market price is either above or below the equilibrium price
Effects of price rise
If the price is above the equilibrium price
>Product is too expensive
>Supply is more than demand
To sell of the excess supply the price must be reduced
Effects of price fall
If the price is below the equilibrium price
>Product is too cheap
>Demand is more than supply
To create an incentive to supply more, the price must be raised
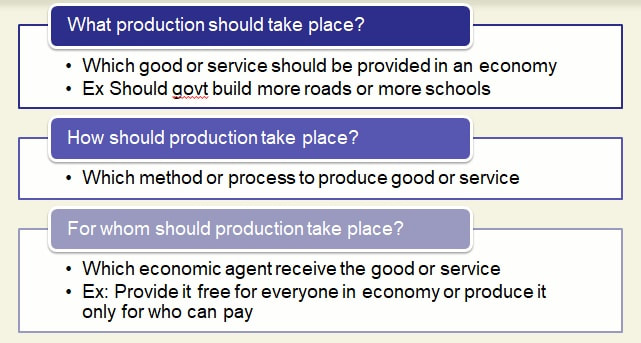
Key decisions about allocation of resources
Market consists of
–Buyers (who have demand for a particular goods and services)
–Sellers (suppliers of particular goods and services)
Market equilibrium
Market equilibrium occurs when the demand of a product matches the supply
An equilibrium price and quantity are established, when the opposing market forces of supply and demand are in balance
Market disequilibrium occurs when the market price is either above or below the equilibrium price
Effects of price rise
If the price is above the equilibrium price
>Product is too expensive
>Supply is more than demand
To sell of the excess supply the price must be reduced
Effects of price fall
If the price is below the equilibrium price
>Product is too cheap
>Demand is more than supply
To create an incentive to supply more, the price must be raised
Key decisions about allocation of resources
Demand
Demand refers to both the willingness and the ability of customer to pay a given price to buy a good or service
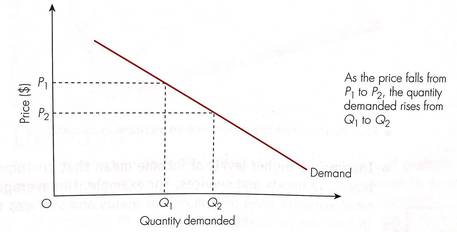
The amount of good or service demanded at each price level is called the quantity demanded
> Quantity demanded falls as price rises
> Quantity demanded rises at lower price
There is an inverse relationship between the price and quantity demanded.
This rule is known as the law of demand
Two reasons why the demand rise when the price fall
1.The customer is able to buy more with the their same income
2.Higher number of customers are able to buy
Determinants of demand
•Habit, fashion and taste
•Income
•Substitute and complements
•Advertising
•Government policies
•Economy
Can be remembered by the acronym HIS AGE
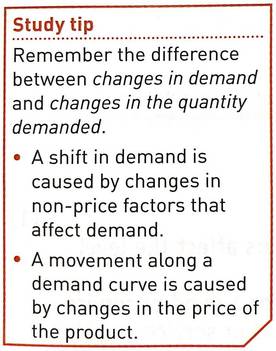
Price and Demand: Movement along demand curve
The demand curve is shown as a downward-sloping curve
–This indicates inverse relationship between price and quantity demanded
The amount of good or service demanded at each price level is called the quantity demanded
> Quantity demanded falls as price rises
> Quantity demanded rises at lower price
There is an inverse relationship between the price and quantity demanded.
This rule is known as the law of demand
Two reasons why the demand rise when the price fall
1.The customer is able to buy more with the their same income
2.Higher number of customers are able to buy
Determinants of demand
•Habit, fashion and taste
•Income
•Substitute and complements
•Advertising
•Government policies
•Economy
Can be remembered by the acronym HIS AGE
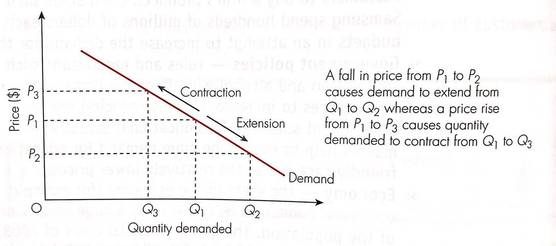
Price and Demand: Movement along demand curve
The demand curve is shown as a downward-sloping curve
–This indicates inverse relationship between price and quantity demanded
•Price rise cause a contraction in demand
•Price fall cause an extension in demand
•Price fall cause an extension in demand
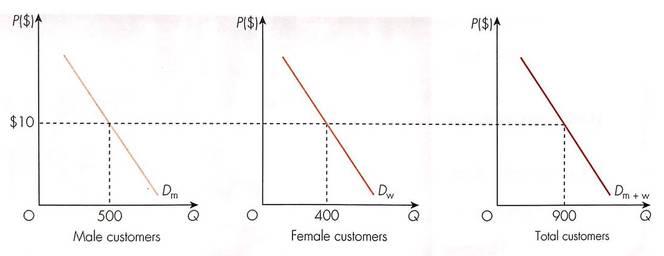
Individual demand and market demand
The market demand refers to the sum of all the individual demands for a products
–Ex at $10 per cinema ticket
•Demand form males customer 500 per week
•Demand from female customers 400 per week
•Total demand at $10 = 900 per week
The market demand refers to the sum of all the individual demands for a products
–Ex at $10 per cinema ticket
•Demand form males customer 500 per week
•Demand from female customers 400 per week
•Total demand at $10 = 900 per week
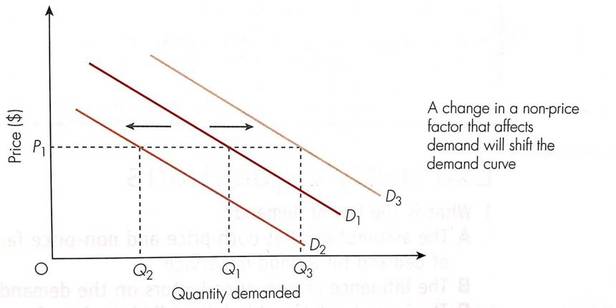
Shift in the demand curve
Change in non price factors shift the demand curve outward or inward
Increase in demand (rather than an increase in the quantity demanded) is represented by a rightward shift in the demand curve (D1 to D3)
A decrease in demand (rather than an decrease in the quantity demanded) is shown by shifting the demand curve to the left (D1 to D2)
Supply
Supply refers to both the willingness and the ability of firm to provide goods or services at given price levels
The amount of good or service supplied at each price level is called the quantity supplied
–Quantity supplied rises as price rises
–Quantity supplied falls at lower price
There is an positive relationship between the price and supply.
This rule is known as the law of supply
Two reasons why the supply rise when the price rise
1.Existing firms can earn more if they supply more
2.New firms are able to join the market if higher price allows them to cover production cost
Determinants of supply
•Time
•Weather
•Opportunity cost
•Taxes
•Innovations
•Production costs
•Subsidies
Can be remembered by the acronym TWO TIPS
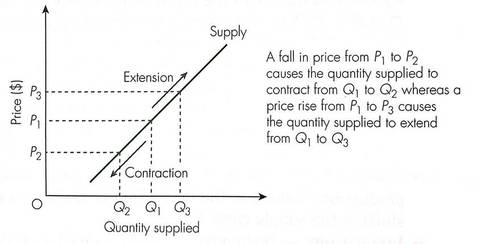
Price and Supply: Movement along the supply curve
The supply curve is shown as a upward-sloping curve
–This indicates positive relationship between price and quantity supplied
The amount of good or service supplied at each price level is called the quantity supplied
–Quantity supplied rises as price rises
–Quantity supplied falls at lower price
There is an positive relationship between the price and supply.
This rule is known as the law of supply
Two reasons why the supply rise when the price rise
1.Existing firms can earn more if they supply more
2.New firms are able to join the market if higher price allows them to cover production cost
Determinants of supply
•Time
•Weather
•Opportunity cost
•Taxes
•Innovations
•Production costs
•Subsidies
Can be remembered by the acronym TWO TIPS
Price and Supply: Movement along the supply curve
The supply curve is shown as a upward-sloping curve
–This indicates positive relationship between price and quantity supplied
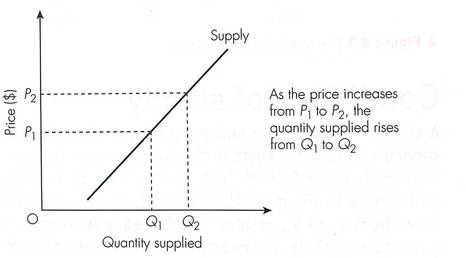
Movement along the supply curve occur only if the price of the product changes. Change in price cause a change in the quantity supplied
•Price rise cause an extension in supply
•Price fall cause a contraction in supply
•Price rise cause an extension in supply
•Price fall cause a contraction in supply
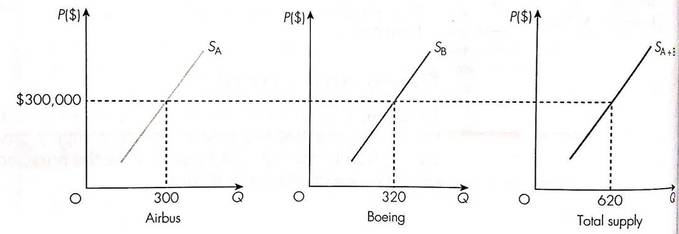
Individual supply and market supply
The market supply refers to the sum of all the individual supply of a products at each price level
–Ex at $300,000 per aircraft price
•Supply form Airbus = 300 aircrafts per time period
•Supply from Boeing = 320 aircrafts per time period
•Total supply at $300,000 = 620 aircrafts per time period
The market supply refers to the sum of all the individual supply of a products at each price level
–Ex at $300,000 per aircraft price
•Supply form Airbus = 300 aircrafts per time period
•Supply from Boeing = 320 aircrafts per time period
•Total supply at $300,000 = 620 aircrafts per time period
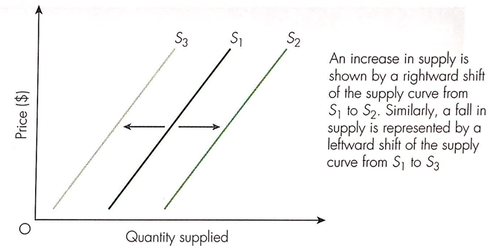
Shift of the supply curve
Movement along the supply curve is due to change in price
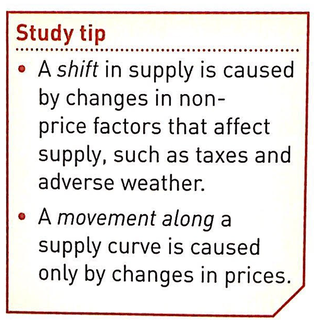
But, change in non price factors shift the supply curve outward or inward
>Increase in supply (rather than an increase in the quantity supplied)
=> rightward shift in the supply curve (S1 to S2)
>Decrease in supply (rather than an decrease in the quantity supplied)
=> Leftward shift in the supply curve (S1 to S3)
Movement along the supply curve is due to change in price
But, change in non price factors shift the supply curve outward or inward
>Increase in supply (rather than an increase in the quantity supplied)
=> rightward shift in the supply curve (S1 to S2)
>Decrease in supply (rather than an decrease in the quantity supplied)
=> Leftward shift in the supply curve (S1 to S3)
Price determinant
Market Equilibrium
Market equilibrium refers to the position where the demand for a product is equal to the supply of the product
Market equilibrium refers to the position where the demand for a product is equal to the supply of the product
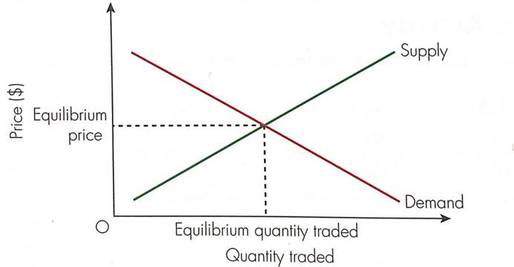
At this point, an equilibrium price is established
At equilibrium price, equilibrium quantity is established
–Neither excess quantity demanded
–Nor excess quantity supplied
Equilibrium price
Price at which the demand curve for a product insects the supply curve for the product. The market is therefore cleared of any excess demand or supply
Market disequilibrium
Market disequilibrium occurs when the quantity demanded for a product is either higher or lower than the quantity supplied.
Disequilibrium is inefficient as it means there are either shortage or surplus
Shortage
Occurs when the selling price is lower than the equilibrium price, Pe
-Demand exceeds supply
-This excess demand creates shortage in the market
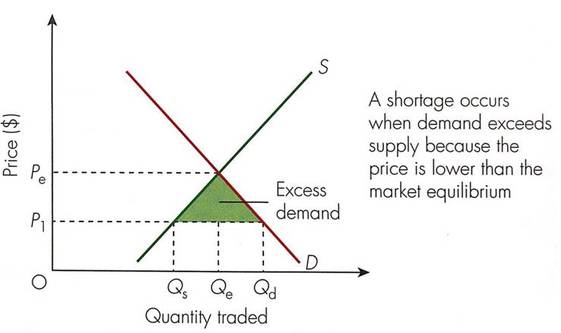
The excess demand will tend to cause price to rise back towards the equilibrium price, Pe
Surplus
•Occurs when the selling price is set higher than the equilibrium price, Pe
-Supply exceeds demand
-This excess supply creates surplus in the market
Surplus
•Occurs when the selling price is set higher than the equilibrium price, Pe
-Supply exceeds demand
-This excess supply creates surplus in the market
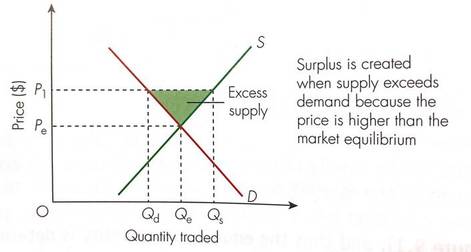
In order to get rid of surplus, the firms need to reduce their price to Pe
–Ex: Leftover Chistmas cards are reduced in price after 25th Dec
–Ex: Unsold summer clothes go on sale during autumn
–Ex: Leftover Chistmas cards are reduced in price after 25th Dec
–Ex: Unsold summer clothes go on sale during autumn
Price Change
(Due to shift of demand and supply curve)
Supply curve: Leftward Shift
Leftward shift can be caused by factors like
–Increase in sales tax
–Adverse weather
–Cut in subsidy
–Increase in production cost
–Etc…
Let’s consider an example of leftward shift of the supply curve
Example: Sales tax imposed on tobacco product
Leftward shift can be caused by factors like
–Increase in sales tax
–Adverse weather
–Cut in subsidy
–Increase in production cost
–Etc…
Let’s consider an example of leftward shift of the supply curve
Example: Sales tax imposed on tobacco product
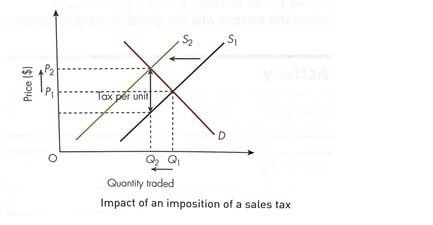
-Rise in the market equilibrium price from P1 to P2
-Reduction in the equilibrium quantity traded from Q1 to Q2
Supply curve: Rightward Shift
Rightward shift can be caused by factors like
–Reduction in Sales tax
–favorable weather
–Subsidy
–Decrease in production cost
–Etc….
Let’s consider an example of rightward shift of the supply curve
Example: Favourable weather condition on agricultural output
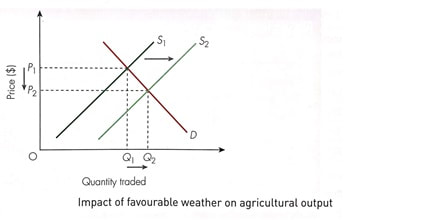
-Fall in the market equilibrium price from P1 to P2
-Increase in the equilibrium quantity traded from Q1 to Q2
Demand curve: Leftward Shift
Leftward shift can be caused by factors like
–Bad advertizing
–Negative publicity
–Low price of substitute products
–Lower household income
–Recession
–Etc…
Let’s consider an example of leftward shift of the demand curve.
Example: Impact of mass unemployment on the market of helium balloons
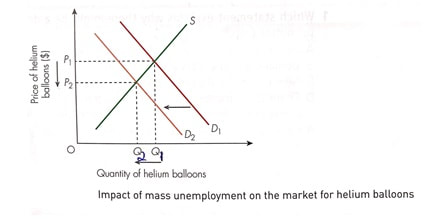
-Fall in the market equilibrium price from P1 to P2
-Reduction in the equilibrium quantity traded from Q1 to Q2
Demand curve: Rightward shift
Rightward shift can be caused by factors like
–Persuasive advertizing
–High price of substitute products
–High household income
–Economic boom
–Etc…
Let’s consider an example of rightward shift of the demand curve
Example: Impact of high household income on the market for new cars
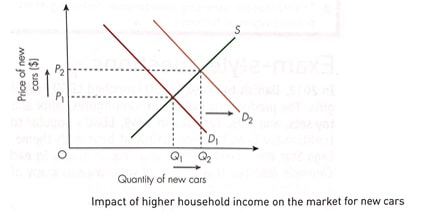
-Rise in the market equilibrium price from P1 to P2
-Rise in the equilibrium quantity traded from Q1 to Q2
-Rise in the equilibrium quantity traded from Q1 to Q2
